This page refers to a previous version of the add-in for Excel (2007 to 2016)
For Excel 365, use the lastest add-in version
Data Input
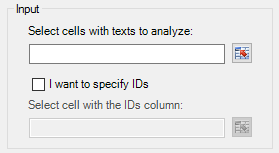
For every analysis available, the first thing you will have to define is the data that you are going to analyze. For this purpose, all the interfaces associated to the different analyses have a section called Input. Its structure will be always the same: there will be a textbox to introduce the mandatory data for the analysis it refers to, generally the texts, and an additional textbox to add the IDs associated to those texts.
This is an example of this format:

The selection of the texts will be done by selecting a range of cells in the Excel sheet. To do so, there are two possibilities:
- Write the range directly in the corresponding textbox with the adequate format.
- Click the button to the right of the textbox; this will show a dialog that will enable you to select the range directly from the Excel spreadsheet in which you are working.
There are some limits to the ranges you can select; mandatory data (first textbox included in the input section) are limited to one column and a maximum of 10000 cells.
As it has been mentioned, after introducing the mandatory data, it's possible to specify identifiers associated to the texts that are going to be analyzed to be able to univocally identify each one in your system. This is particularly important since the result will be displayed in another sheet.
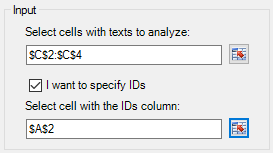
This textbox will appear disabled by default, as its use is optional. To enable it, there's a checkbox right after the first textbox. To specify the IDs, select any one of the cells included in the column containing them: the add-in will automatically pick the correspondent value for each row included in the text selection.
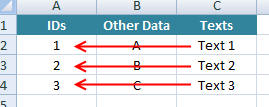
For instance, if you select the input shown in the left image, then the IDs selected would be the ones shown in the image in the center, which will result in the image on the right:


